Ben__Walther
Fantom — Another Leg Down? Chart And Indicators Say Yes! 🚨
FTM dipped ~35% during the last few days. Even worse, current technical indicators and charts indicate more downside potential.
Here's why:
1️⃣ Bearish MACD Crossover
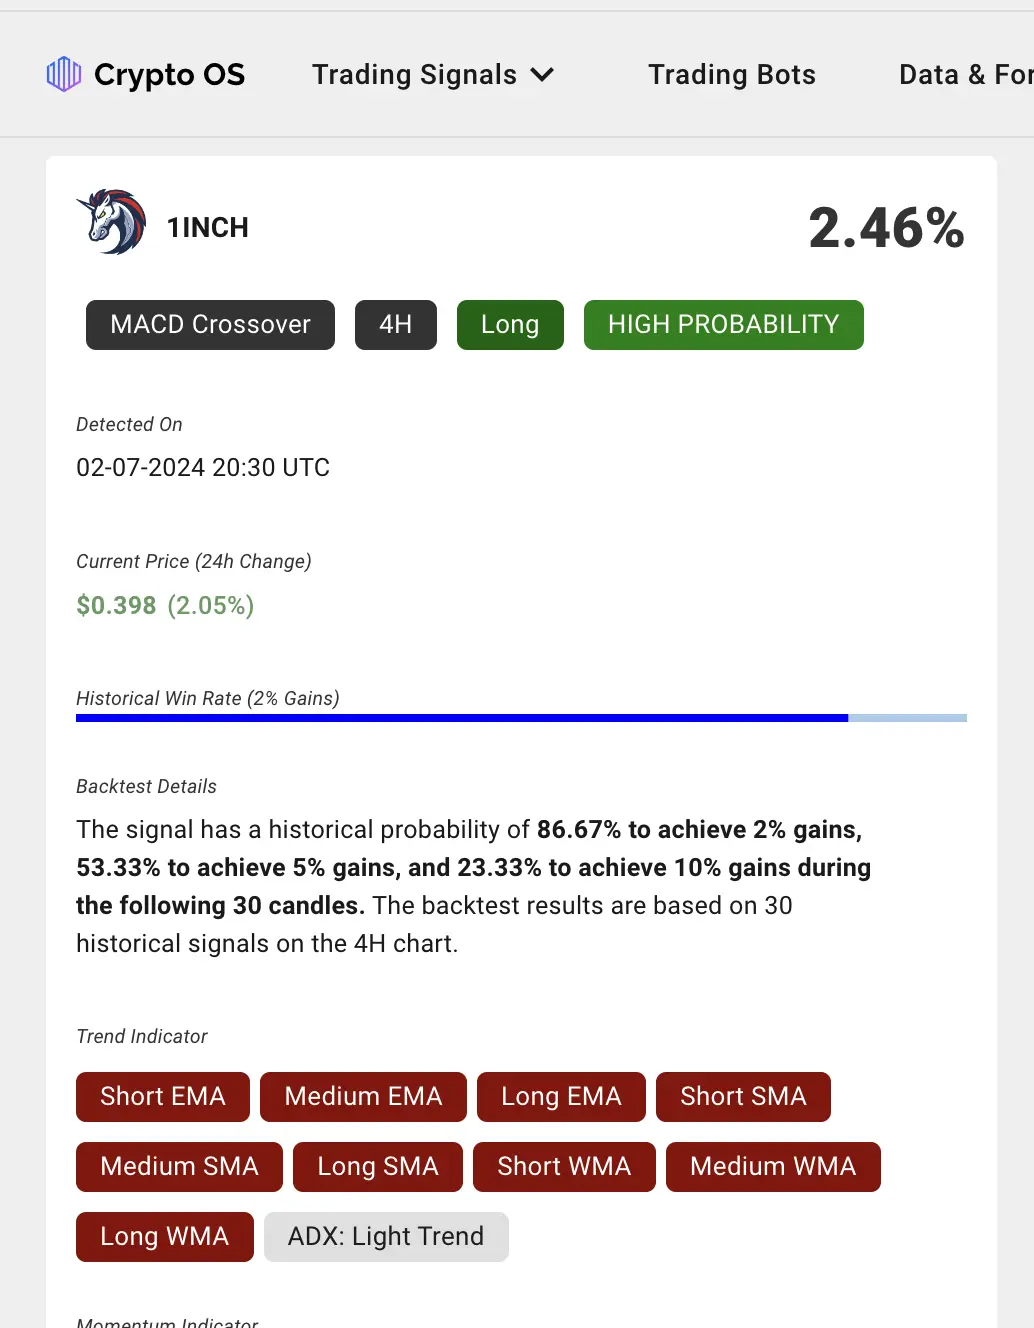
FTM flashed a bearish MACD crossover on the 4H chart. Based on backtests, the signal is solidly reliable when it comes to 2%—5% profit targets (downside potential in our case).
2️⃣ Bear Flag
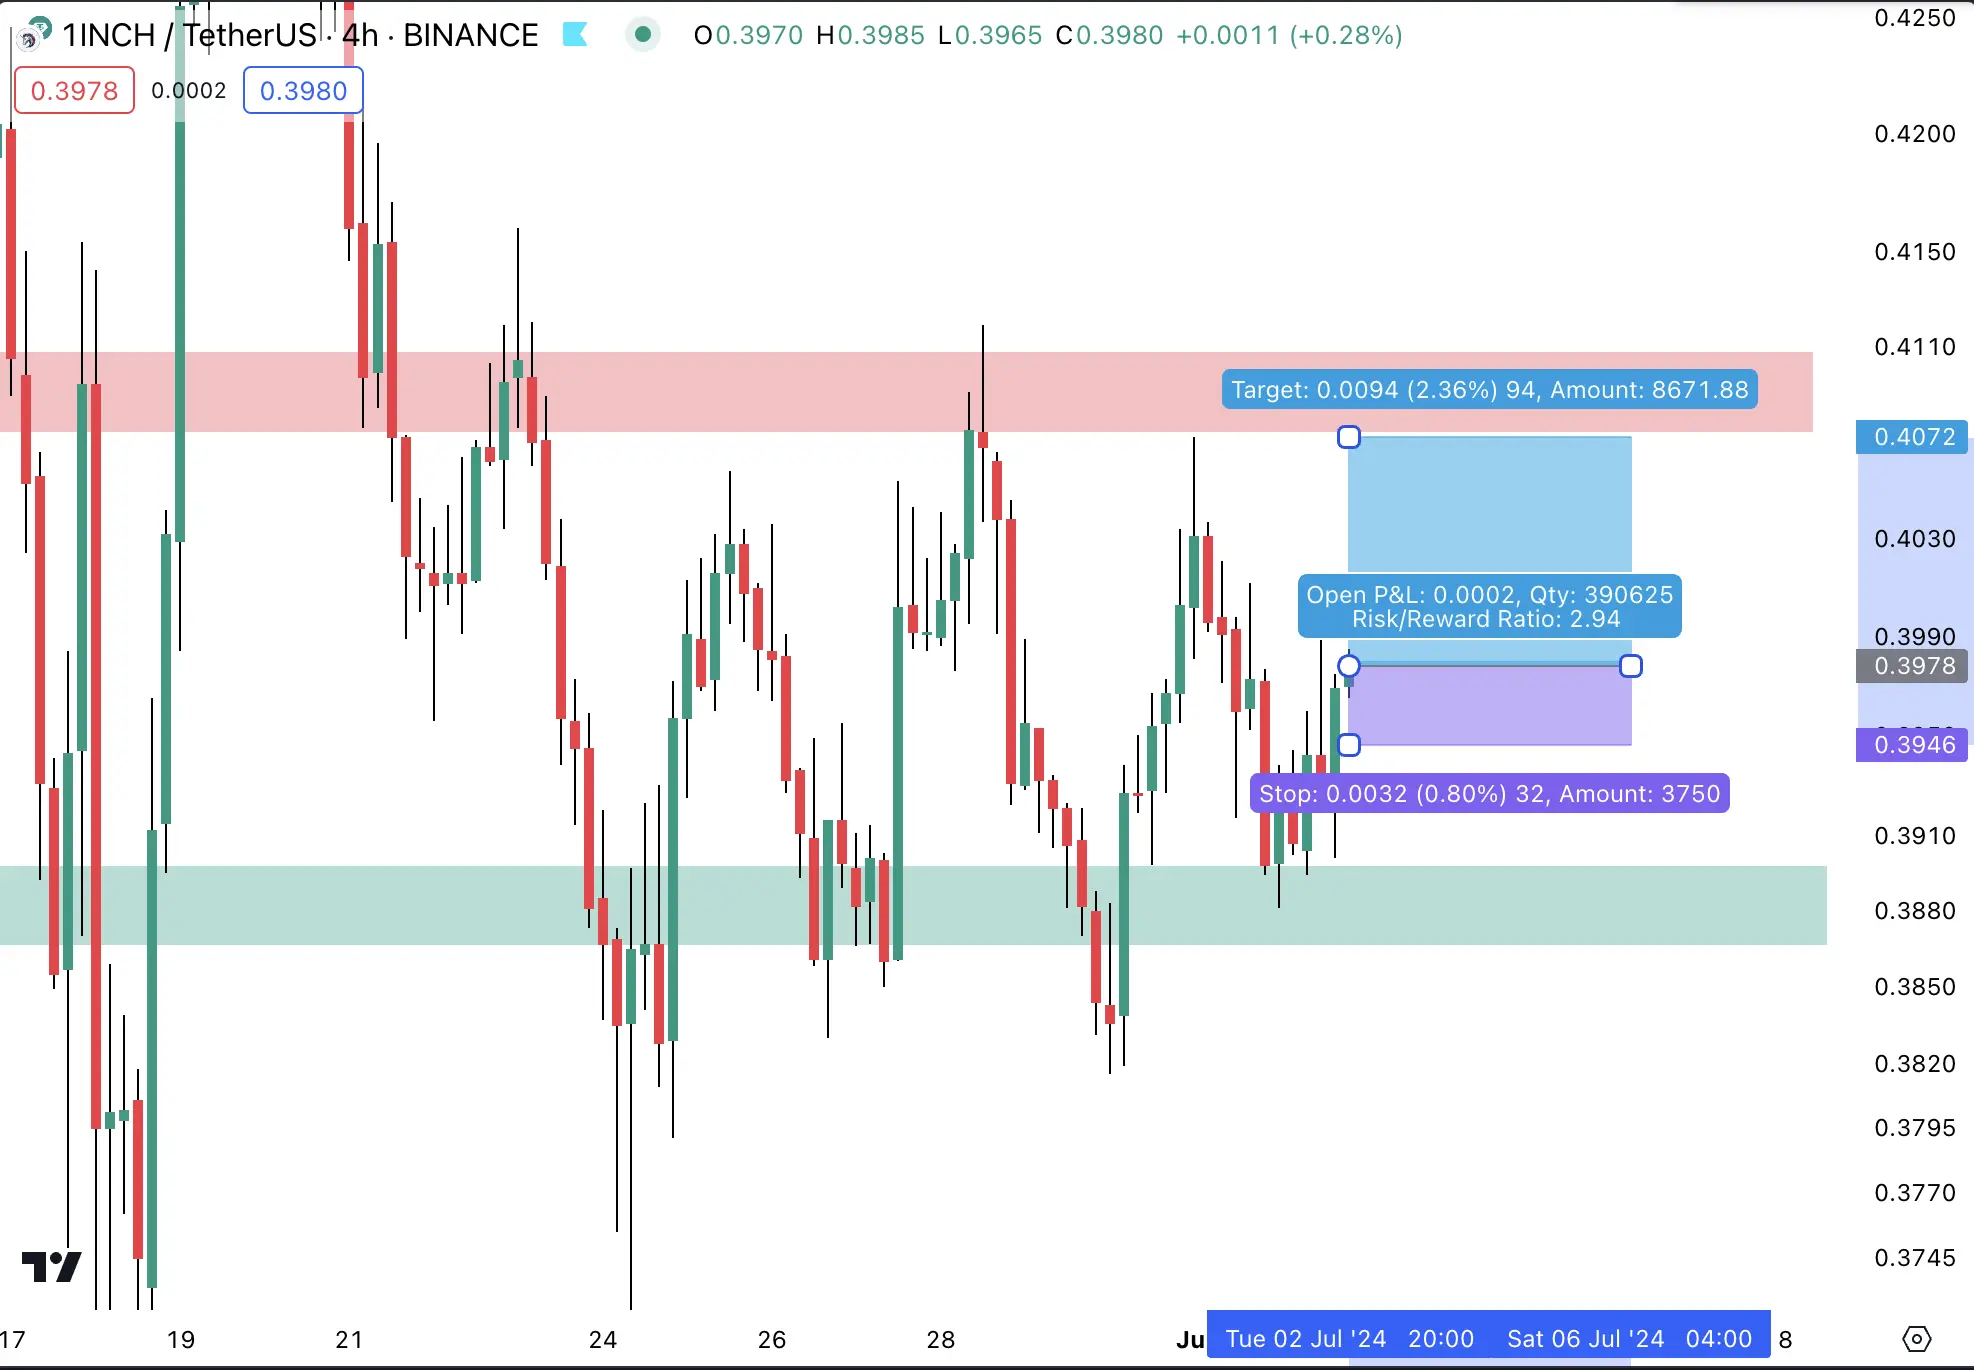
Moreover, the 4H chart indicates that Fantom trades in a playbook bear flag pattern.
How To Enter 👇
Wait for a break of the lower bear flag boundary and confirmation. As a first pr
FTM dipped ~35% during the last few days. Even worse, current technical indicators and charts indicate more downside potential.
Here's why:
1️⃣ Bearish MACD Crossover
FTM flashed a bearish MACD crossover on the 4H chart. Based on backtests, the signal is solidly reliable when it comes to 2%—5% profit targets (downside potential in our case).
2️⃣ Bear Flag
Moreover, the 4H chart indicates that Fantom trades in a playbook bear flag pattern.
How To Enter 👇
Wait for a break of the lower bear flag boundary and confirmation. As a first pr